This week’s mortgage rates, and whether refinancing pays off.
Freddie Mac’s 30- and 15-year averages the day they’re published, a daily signal from the 10-year Treasury, and a refinance calculator that shows when a new loan really pays for itself, on your own numbers.
Coming soon to the App Store and Google Play.
Every Thursday, noon ET
Daily 10-yr signal
History since 1971
No sign-up
En español
Latest mortgage rates
Freddie Mac weekly average · Oct 1, 2026
30-Year Fixed
0.00%+0.00 this week
15-Year Fixed
0.00%+0.00 this week
30-year, last 52 weeks0.00% – 0.00%
Oct 2025Oct 2026
10-year Treasury yieldDaily signal · Oct 2
0.00%(+0.00)
Source: Freddie Mac Primary Mortgage Market Survey®; 10-year yield: U.S. Treasury. National averages for well-qualified borrowers, not offers. The app adds a daily estimate, alerts and your own numbers.
Updated every Thursday at noon Eastern — get the app for the latest.
Freddie Mac’s 30- and 15-year averages, the 10-year Treasury every business day, and history back to 1971.
Get the app
What’s inside
Rates, the math, and a heads-upwhen it matters.
Five tabs (Rates, Refinance, Payment, Afford and Alerts), a home-screen widget, and nothing to sign up for. Everything you enter stays on your phone.
Weekly rates, plus a daily signal
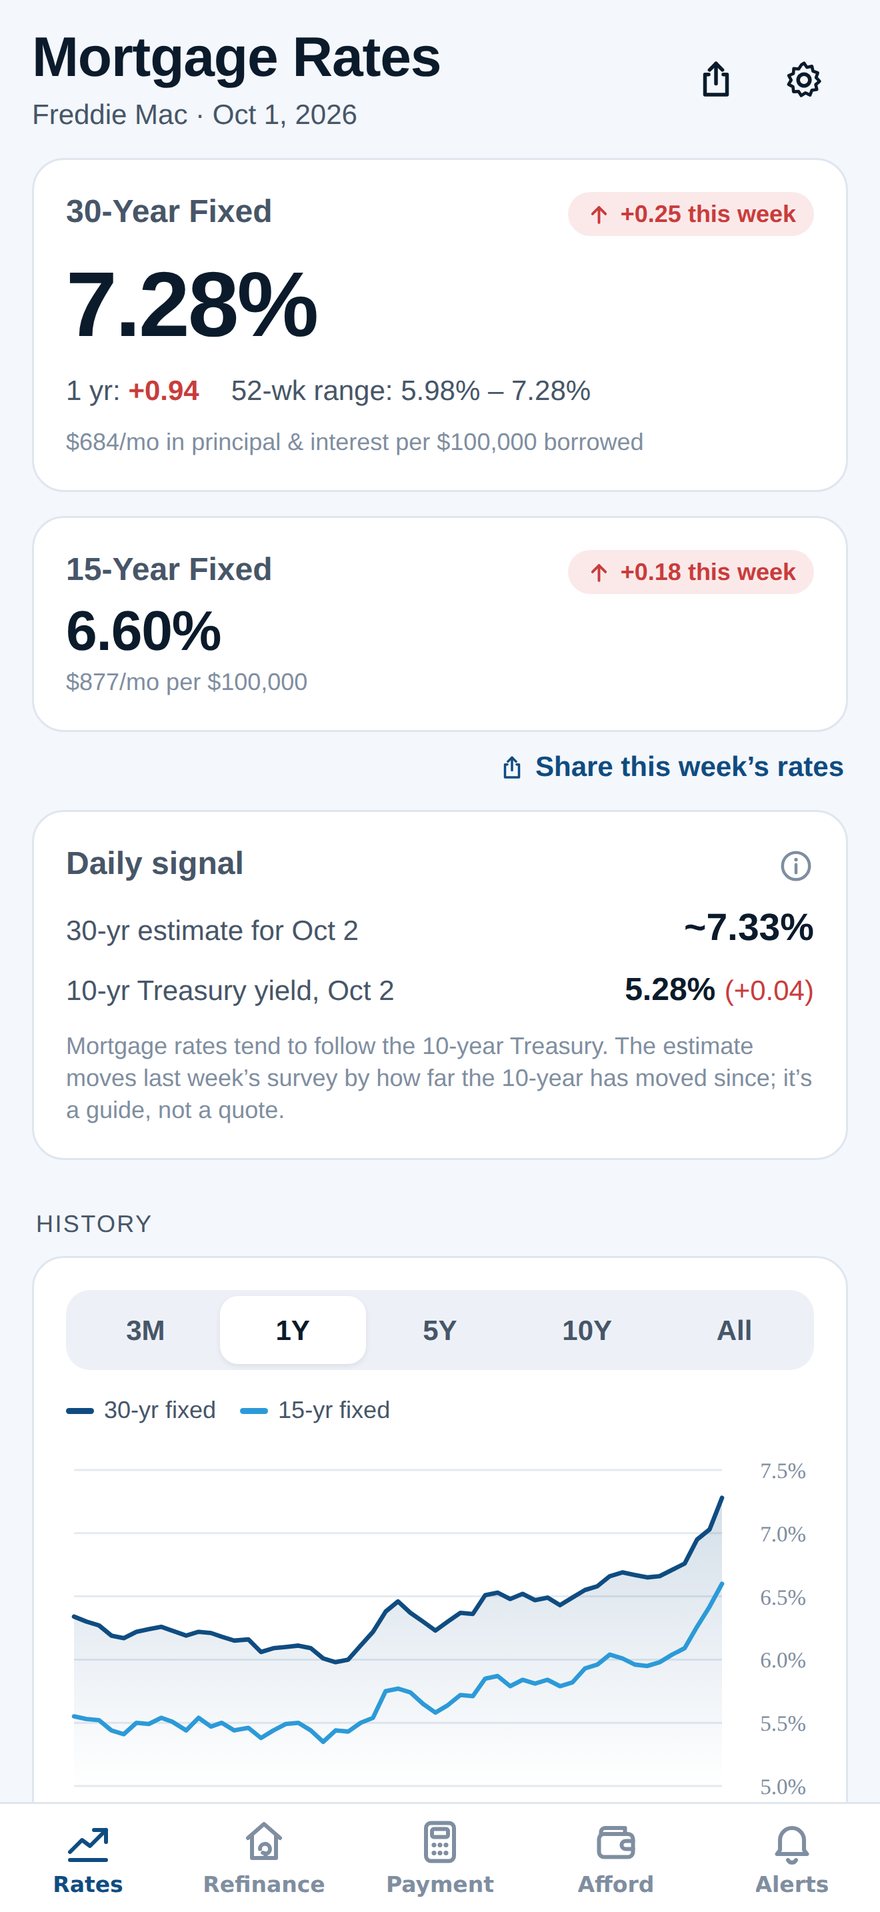
Freddie Mac’s 30- and 15-year fixed averages every Thursday at noon Eastern, with the week’s change and the 52-week range. Between surveys, the 10-year Treasury yield and a clearly labeled daily estimate show which way things are leaning.
Refinance, with a true break-even
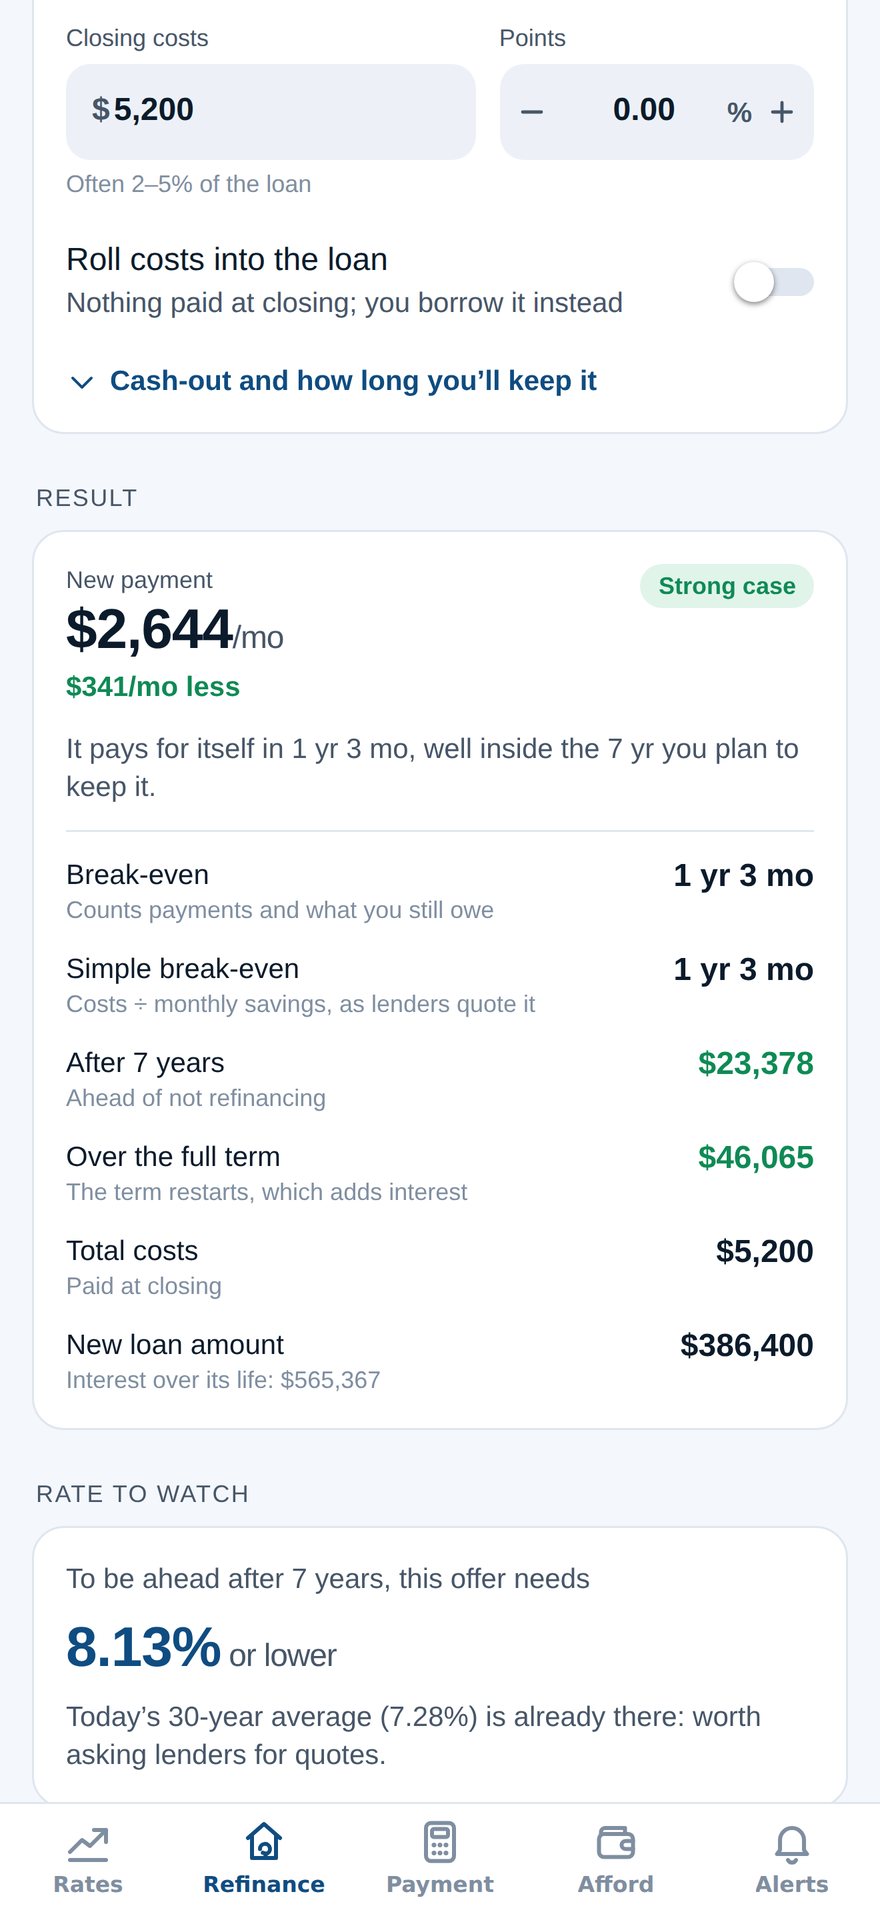
Your new payment and monthly savings, the simple break-even lenders quote, and a true break-even that counts payments plus the balance you still owe. Then where you stand after the years you’ll keep the loan, and the rate an offer needs to come out ahead, with a one-tap alert at it.
One offer free
Compare 3 offers: Pro
Payment calculator
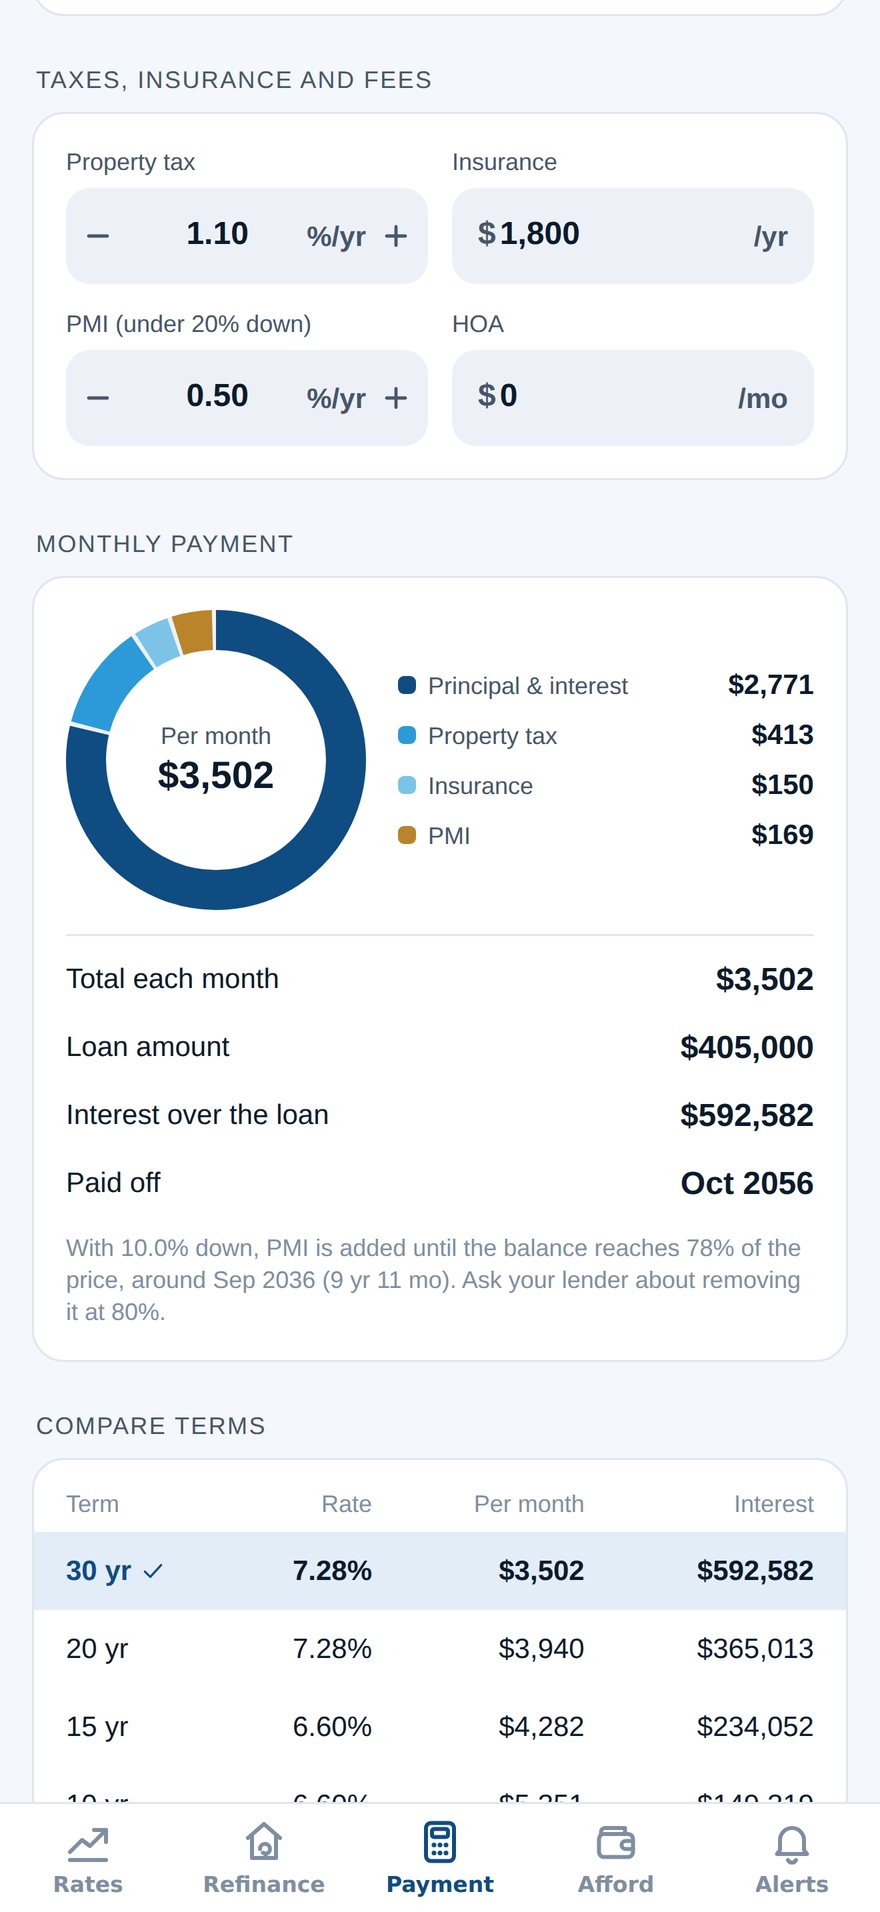
Principal and interest, property tax, insurance, PMI until you reach 78% loan-to-value, HOA dues, and the cash you’ll need at closing. Pay extra each month, every two weeks or as a lump sum to see how much sooner you’d pay off the loan and how much interest you’d save.
Yearly schedule free
Monthly + CSV: Pro
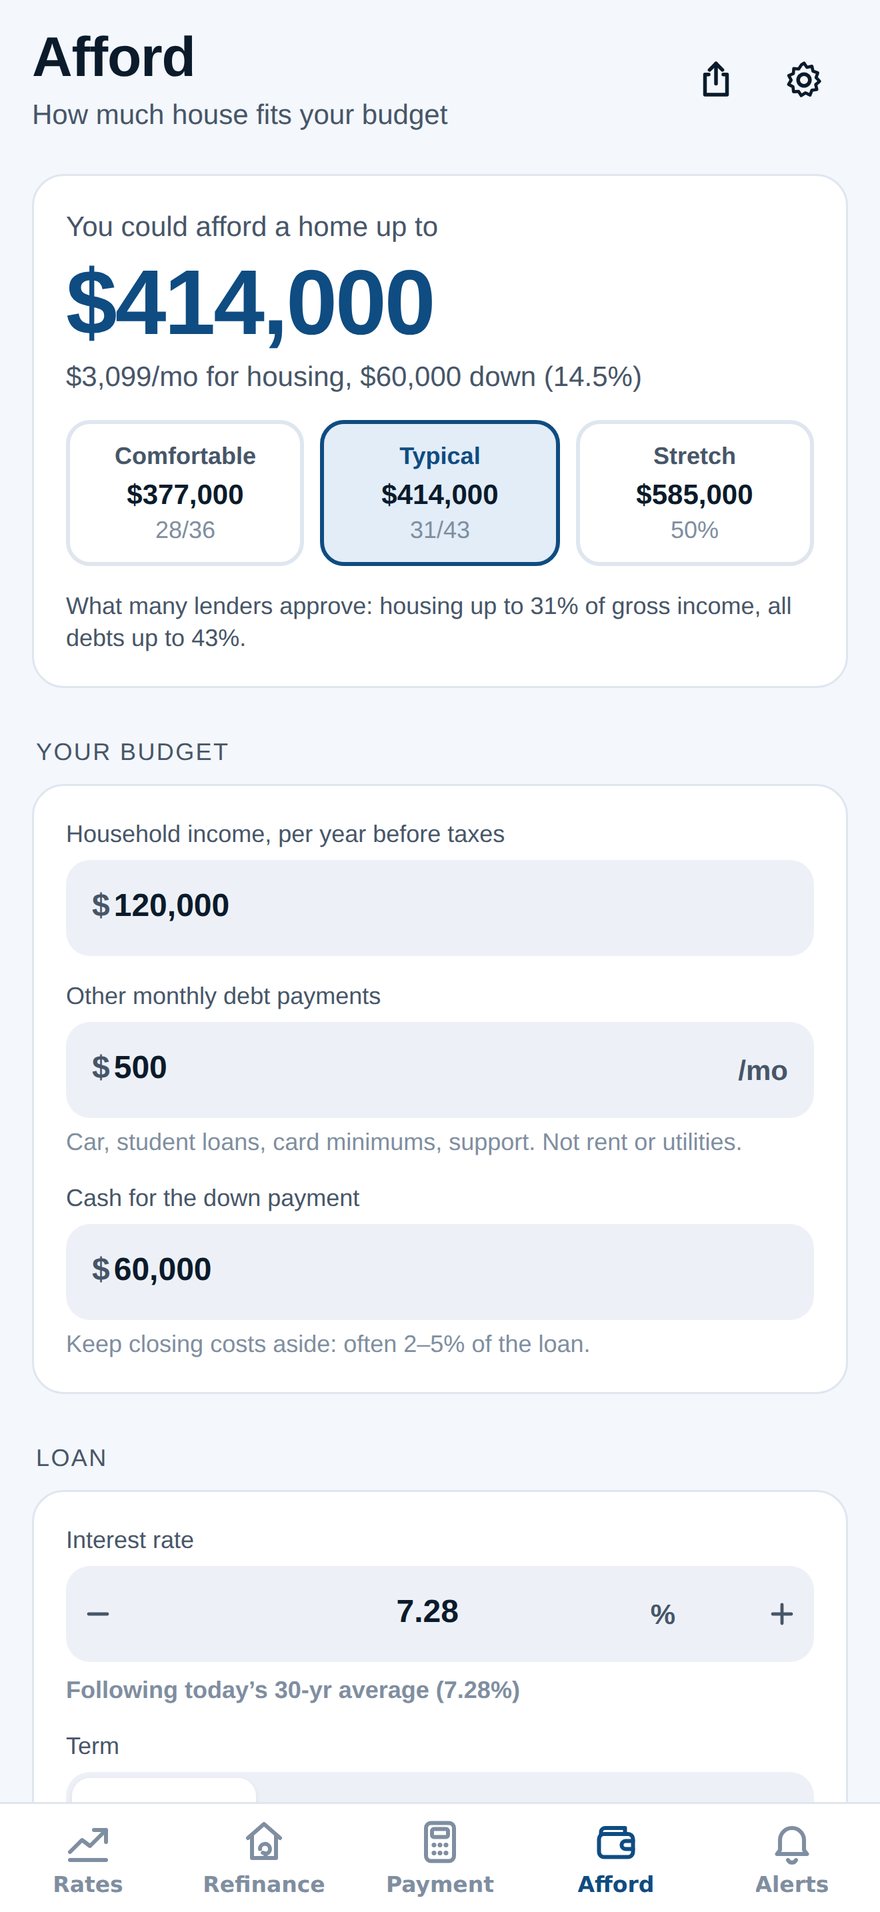
How much house can you afford?
Your income, other debts and the cash for a down payment give the highest price at three comfort levels, from the 28/36 rule to what many lenders allow, with the monthly cost and your debt-to-income ratios.
Rent or buy?
Your rent against the home you’re looking at: what you’d have after the years you’d stay, counting upkeep, selling costs and the down payment you could invest instead. With how long you’d need to stay for buying to win, and the rent at which the two tie.
Homes and terms, side by side
See the same home at 30, 20, 15 and 10 years. Save the homes you’re weighing and line them up: the monthly cost, the cash to close and the interest, with the best of each marked.
Terms, saved homes free
Homes in columns: Pro
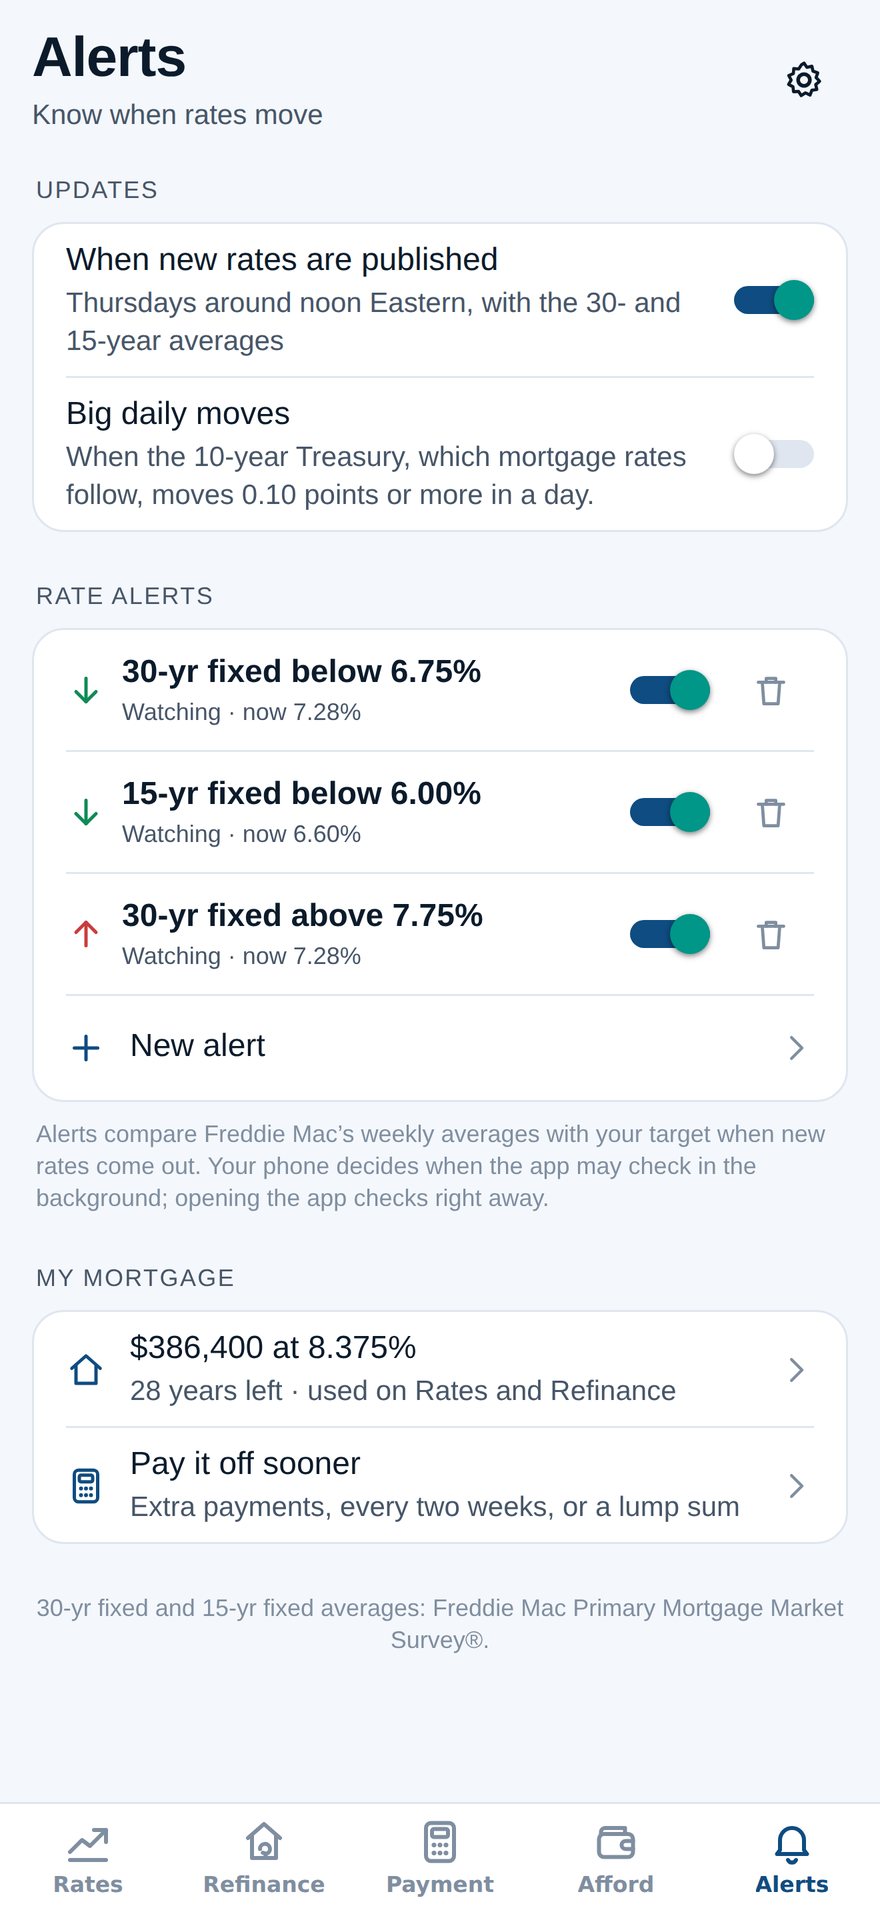
Rate alerts, the Thursday update, big moves
Pick a target for the 30- or 15-year average and get a notification when a new survey crosses it, or just get the new numbers every Thursday. With Pro, hear when the 10-year Treasury, which mortgage rates follow, makes a big move in a day.
1 alert free
Unlimited + daily moves: Pro
History back to 1971
The 30-year average every week since April 1971, and the 15-year since 1991. See how today compares with the 1981 peak and the 2021 low.
3M · 1Y free
5Y · 10Y · All: Pro
What’s coming up
When Freddie Mac’s next survey comes out (a day early in holiday weeks) and when the Fed next decides. The Fed sets short-term rates; mortgage rates follow the 10-year Treasury more closely, but a Fed surprise can move both.
My mortgage
Save your current loan once. The Rates tab shows what today’s average could mean for you, the refinance calculator starts from it, and the payoff planner shows how much sooner extra payments would clear it.
Rates on your home screen
A widget with this week’s 30- and 15-year averages and how they moved, plus a year of the 30-year rate. On iPhone, on the Lock Screen too.
Share the answer
Post this week’s rates as a clean image card, with your name on it if you like, or send a refinance analysis, a payment, a payoff plan or a rent-or-buy result as a short summary.
Light and dark mode. No account, no sign-up, no analytics.
Refinance, honestly
Two break-evens, because the usual one can mislead.
Lenders quote closing costs ÷ monthly savings. That ignores what you still owe, so a new 30-year loan can look better than it is, and a 15-year refinance (higher payment, much faster payoff) gets no answer at all. The app shows both numbers, and where you’d actually stand.
New payment and monthly savings
The simple and the true break-even, side by side
Ahead or behind after the years you’ll keep the loan, and over the full term
Closing costs, points, rolling costs into the loan, cash-out
Up to three offers side by sidePRO
Example
You owe $340,000 at 7.79% with 27 years left, paying $2,516/mo in principal and interest. A new 30-year loan at 7.28% with $5,000 in closing costs:
New payment
$2,326/mo
$190/mo less
Worth it
Break-evenCounts payments and what you still owe3 yr 1 mo
Simple break-evenCosts ÷ monthly savings, as lenders quote it2 yr 2 mo
After 7 yearsAhead of not refinancing$5,343
Over the full termThe term restarts, which adds interest−$27,164
Ahead after seven years, behind by the end: part of the lower payment comes from stretching 27 years back out to 30. Estimates for comparison, not advice.
The app
Five tabs. Nothing to sign up for.
Rates, Refinance, Payment, Afford and Alerts, in light or dark mode.
Rates
This week’s averages and their change, the daily signal, and history.
Refinance
Your loan against a new one, with both break-evens.
Payment
Everything in the monthly payment, plus what extra payments save.
Afford
The price your budget reaches, at three comfort levels.
Alerts
A target for the weekly average, and the Thursday update.
Mortgage Rate Tracker Pro
Optional, for when you’re getting serious.
The weekly rates, every calculator, the yearly schedule, the widget and one alert are free. Pro takes the ads away and opens the deeper tools.
No ads
Unlimited rate alerts, and alerts on big daily moves
Full rate history: 5 years, 10 years, or every week since 1971
Refinance offers and saved homes side by side
Month-by-month payment schedule, with CSV export
Monthly
Yearly · 7-day free trial
Lifetime · one purchase
Prices are shown in the app in your local currency before you confirm. Subscriptions renew automatically until you cancel in your App Store or Google Play account. Purchases go through Apple or Google, and we never see your payment details.
Just need it today? Watch one optional video and the Pro tools (full history, offers and homes side by side, and the monthly schedule) open for 24 hours.
30-year fixed, every week since 1971
Freddie Mac PMMS®, weekly average
PRO
Peak 18.63%Oct 1981
Low 2.65%Jan 2021
Latest 0.00%
Every weekly survey since April 1971, charted in the app. 5-year, 10-year and full history are part of Pro.
Questions
The short answers.
Is it free?
Yes. The weekly rates, the daily signal, the payment, affordability, rent-or-buy, payoff and refinance calculators, the yearly payment schedule, the home-screen widget and one rate alert are free, with ads. Mortgage Rate Tracker Pro is optional: a monthly or yearly subscription (yearly has a 7-day free trial for new subscribers) or a one-time lifetime purchase. It removes the ads and adds unlimited alerts with big daily moves, the full rate history, offers and saved homes side by side, and the monthly schedule with CSV export. You can also watch an optional video to open those Pro tools for 24 hours.
Where do the rates come from?
The 30- and 15-year fixed averages are from Freddie Mac’s Primary Mortgage Market Survey® (PMMS), published Thursdays at 12:00 PM Eastern, with weekly history back to April 1971. The daily signal is the U.S. Treasury’s 10-year par yield, published each business day. The app downloads these public files from a copy on this site, or straight from Freddie Mac, the Treasury and the St. Louis Fed’s FRED. Mortgage Rate Tracker isn’t affiliated with Freddie Mac or the U.S. Treasury.
Why do my quotes differ from the averages?
The survey is a national average for well-qualified borrowers: conventional, conforming, fixed-rate home-purchase loans with 20% down and excellent credit. Your rate depends on your credit score, down payment, loan type and size, points, the property, where you live, the lender and the day you lock. Use the averages to see where rates are and which way they’re moving, and get real quotes from lenders.
What’s the daily estimate?
Freddie Mac publishes once a week, but the 10-year Treasury yield moves every business day, and fixed mortgage rates tend to move with it. The daily estimate takes the latest weekly average and adds how far the 10-year yield has moved since that survey’s week. It’s always labeled as an estimate: a direction, not a quote. The next Thursday survey is the real answer.
Do I need an account?
No. There’s no sign-up and no login, and the app has no analytics. Everything you enter stays on your phone, and Settings › Erase my data clears your saved mortgage, homes, inputs and alerts any time.
How do alerts work?
Choose the 30- or 15-year average, above or below a target (say, 30-year below 6.50%), and you’ll get a notification when a new weekly survey crosses it. Turn on the weekly update to get the new numbers on Thursdays. Notifications are created on your phone, with no push server. While an alert or the weekly update is on, the app may check for new rates in the background as often as your phone allows, and opening the app checks right away. One alert is free; Pro makes them unlimited and adds a notification when the 10-year Treasury, which mortgage rates follow, moves a set amount in a day.
How do I cancel Pro?
Subscriptions are managed by the store you bought from: on iPhone, Settings › your name › Subscriptions; on Android, Google Play › Payments & subscriptions › Subscriptions. The app links there from Settings › Manage subscription. Cancel at least 24 hours before the renewal date or the end of the free trial to avoid the next charge; Pro stays on until the end of the period you’ve paid for. The lifetime purchase is a one-time payment with nothing to cancel. Refunds are handled by Apple or Google.
Is this financial advice?
No. Mortgage Rate Tracker shows published national averages and gives estimates for comparison. It isn’t financial advice, a rate quote or an offer of credit, and the app doesn’t lend or arrange loans. Before you buy, refinance or lock a rate, check the numbers with a licensed lender or a financial professional.